Baton Rouge Real Estate Trends for Savvy Buyers & Sellers
November 21, 2025

November 21, 2025
Feeling whiplash from Baton Rouge housing headlines? You are not alone. If you are buying or selling in East Baton Rouge Parish, the numbers can feel confusing until you know which ones matter and how to read them. In this guide, you will learn the core market metrics, what they mean locally, and how to use them to make smarter decisions. Let’s dive in.
Active listings are the homes currently for sale and not under contract. This raw count shows available supply. In Baton Rouge, it can include MLS listings and builder inventory. Some off‑MLS listings may not appear in public searches, so the MLS is the most reliable source.
How to use it: Track active listings over time and compare similar areas, like zip codes or nearby neighborhoods. Rising active listings usually signal more options for buyers and more competition for sellers.
Months supply of inventory, or MSI, is active listings divided by the average monthly closed sales over a set period. Many analysts use 3 months for a quick read and 12 months to smooth seasonality.
How to read it:
Price per square foot, or PPSF, is the sale price divided by finished living area. Use consistent definitions that exclude garages and unfinished space.
How to use it: PPSF works best when you compare similar homes in the same neighborhood. In Baton Rouge, older central neighborhoods and newer suburban communities can show very different PPSF patterns due to lot sizes, finishes, and age of homes.
Days on market, or DOM, measures time from listing to accepted offer. It gives a clear sense of speed.
How to read it:
Higher‑priced or custom homes in Baton Rouge often sit longer than smaller starter homes near central corridors and LSU.
This ratio compares the final sale price to the list price. Numbers near or above 100 percent mean stronger competition. Lower ratios suggest price reductions or buyers negotiating below list.
Track the flow of listings entering and leaving the market. If new listings decline while pending and closed sales rise, conditions are tightening. If new listings build and pending sales soften, leverage shifts toward buyers.
If MSI is below 3 months and median DOM is under 20 days, you can expect multiple offers. Sellers can price confidently with recent comps. Buyers should bring strong pre‑approvals, clean offers, and be ready to move.
If MSI holds between 3 and 6 months, pricing within the neighborhood range matters most. Expect normal negotiation and careful appraisal reviews. Condition and presentation have a bigger impact on results.
If inventory climbs and DOM runs over 60 days, buyers can ask for repairs, credits, and closing cost help. Sellers should plan for longer marketing time and price to the market, not to wishful thinking.
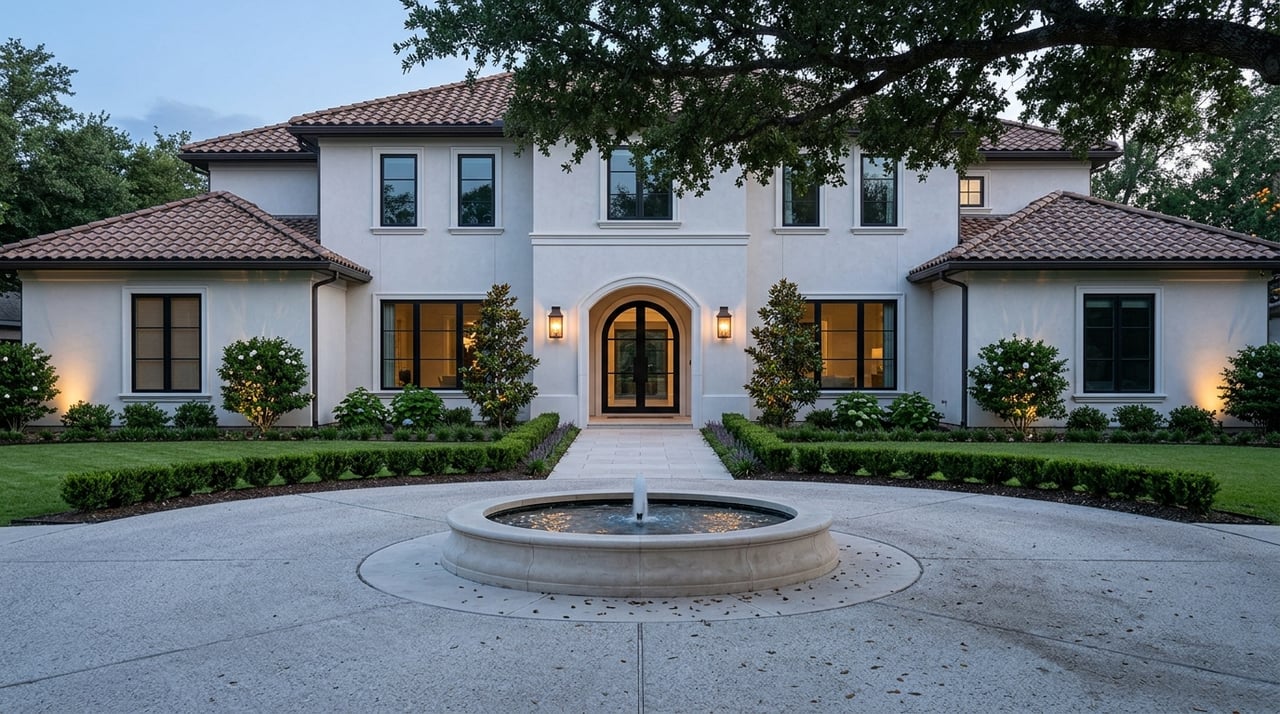
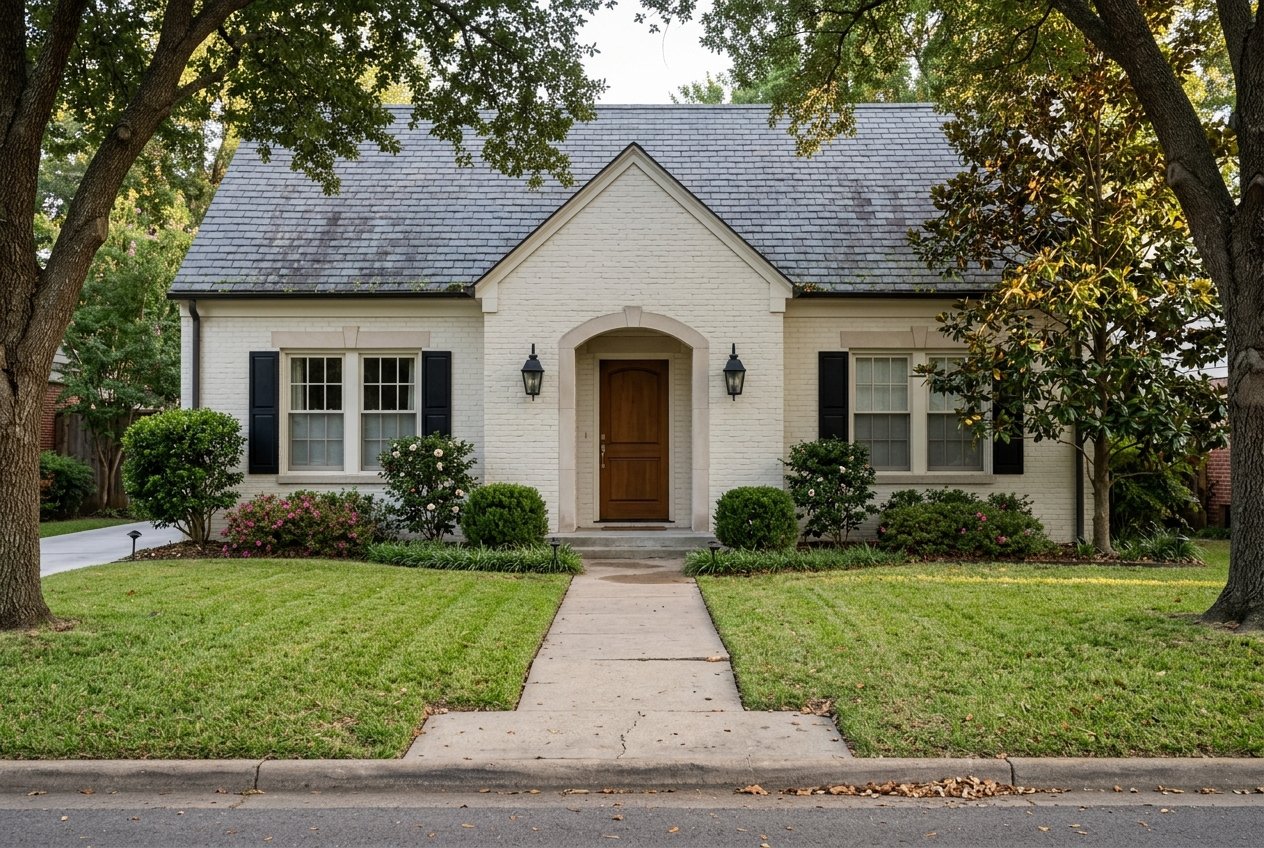
Places like the Garden District, Mid City, Southdowns, and the LSU area have diverse housing stock and lot sizes. PPSF can look high because of location and character. Renovation level matters a lot, so compare to similarly updated homes.
Zachary, Denham Springs, Prairieville, Central, and Baker often see steady new construction alongside resale homes. Builder pricing can set a floor for neighborhood PPSF. DOM can vary by stage of development and commute patterns.
New builds add supply and can attract buyers seeking warranties and modern layouts. Resale inventory in older areas may be tight if owners are staying put or if repairs are needed after weather events. Compare incentives on new homes to recent resale concessions to see where value aligns for you.
State government, LSU, petrochemical plants, healthcare systems, and the Port of Greater Baton Rouge anchor demand. Hiring or slowdowns in these sectors can shift in‑migration and buying power.
Movement between East Baton Rouge Parish and nearby suburbs often reflects commute needs, lot preferences, and other lifestyle factors. Student and faculty demand near LSU influences both rentals and single‑family sales in nearby pockets.
Flood exposure is a major factor in pricing and monthly costs. Always confirm flood zone status and expected insurance premiums early in your process. Parish GIS and FEMA resources can help you verify local risk and overlays.
Spring typically brings more listings and activity in Baton Rouge. Check both a 3‑month view for pulse and a 12‑month view to filter out seasonal bumps.
Assessment cycles, homestead exemptions, and zoning changes can affect carrying costs and neighborhood desirability. If you are planning a move, factor these items into your budget and timing.
The Natasha Engle Team brings design‑forward marketing and hands‑on listing prep to help you stand out. That means staging guidance, professional visuals, and a modern digital launch to reach the right buyers.
If you like to see the data yourself, here is a simple approach:
With that snapshot, you can see whether conditions are tightening or loosening and tailor your plan.
You do not need to predict the future to make a good move in East Baton Rouge Parish. You only need to read the right signals. Watch MSI, DOM, PPSF, and sale‑to‑list ratios at the neighborhood level. Then choose a strategy that fits your goals, timeline, and budget.
If you want a clear, data‑driven plan for your next purchase or sale, let’s talk about your specific neighborhood and price point. Connect with the team that pairs polished marketing with local market expertise. Reach out to The Natasha Engle Team to get started.


Not only do we provide you resources on finding you your new dream home; We will also sell your home quickly with technology that far surpasses the average agent.